
Web Tool for Mapping Storm Surge and Sea-Level Rise
"Se havnivå i kart" has been updated. The new map layers visualize the recommended levels on how municipalities should adapt to rising sea levels and sea level extremes, as taken from the Norwegian Directorate for Civil Protection's (DSB) new guidelines.
The web tool "Se havnivå i kart" shows the effects of rising sea levels and storm surges. Risk maps of affected areas make it easier to plan and prepare in a changing climate.
The guide "Sea Level Rise and High-Water Levels in Community Planning" (only in Norwegian) from the Norwegian Directorate for Civil Protection (DSB) is based on the knowledge base from the report "Sea-level Rise and Extremes in Norway", published in April 2024.
Currently, "Se havnivå i kart" only covers the official levels recommended in the DSB's guide. The map service will be updated with more options in the future.
Identify Risk Areas for Planning
For planning in the coastal zone, "Se havnivå i kart" can be used to identify risk areas. The maps are not suitable for detailed studies or making decisions at a detailed level. In such cases, it is recommended to conduct local analyses.
In addition to risk maps, you can download map layers from Geonorge for use in GIS tools. In a future version of "Se havnivå i kart", you will be able to see statistics on buildings, areas, and roads at risk of flooding from the sea in the service.
Some effects not included in the risk maps:
- Waves
- Changes in storm intensity and frequency due to climate change
- Local processes altering the coastline, such as subsidence or erosion
The impact of river flooding is not included, but flood zone maps are available on the Norwegian Water Resources and Energy Directorate's (NVE) websites.
Please note that there may be errors in data and maps, and there is uncertainty associated with the data and methods. The Mapping Authority reserves the right to update, correct errors, and further develop the service and its accompanying information. Use of the tool and conclusions drawn are the responsibility of the user.
How to Use "Se havnivå i kart"
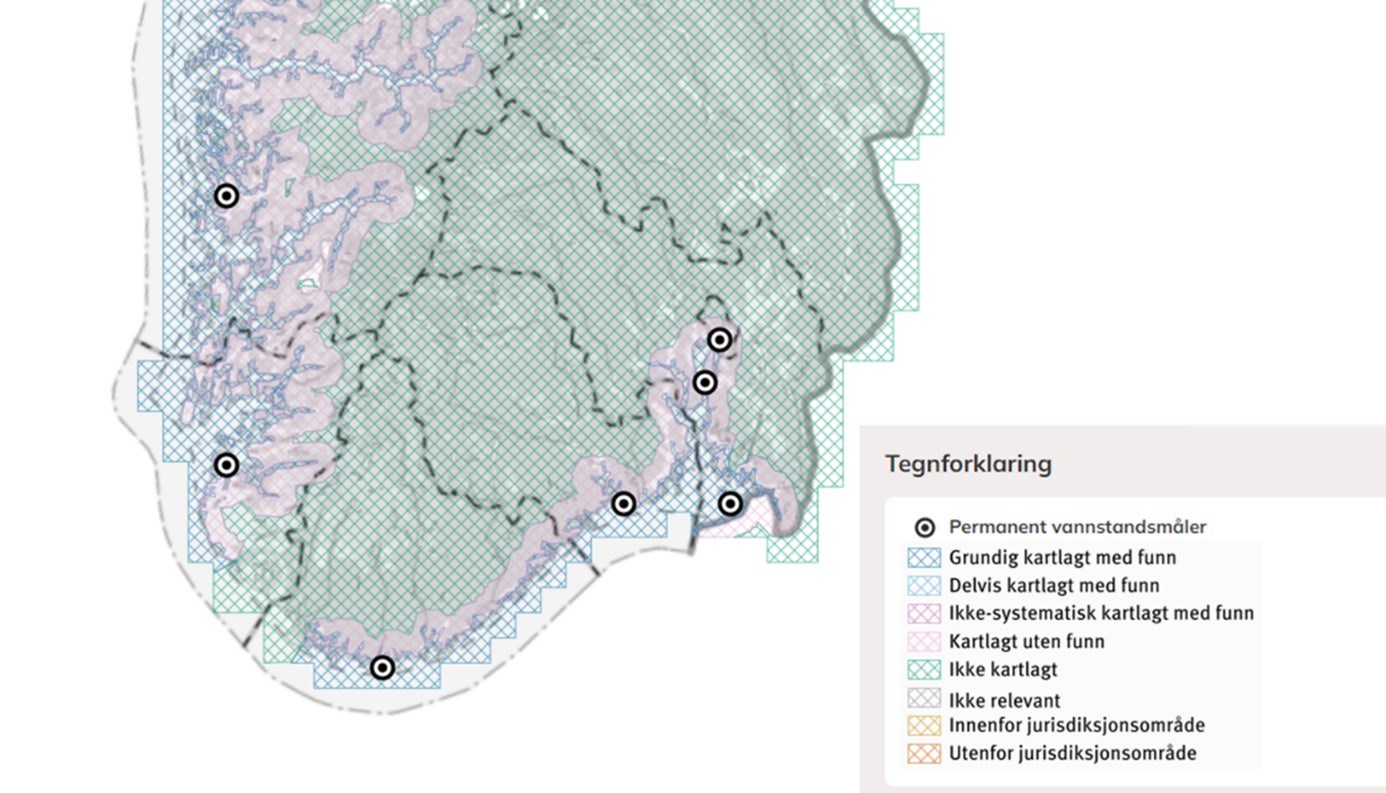
Before searching for a location or if you zoom out far enough, the map will show which areas the webtool covers. Mapped areas are marked with hatched colour codes indicating flooded areas, areas with insufficient data, and areas that cannot be flooded.
The dropdown menu "security class for storm surge" allows you to choose between four different extreme still water levels:
- 20-year return level
- 200-year return level
- 1000-year return level
- a high-end estimate level
The first three correspond to security classes F1, F2, and F3 in the national building regulations (TEK17 §7-2), and the high-end estimate level should be used for buildings covered by TEK17 §7-2, first paragraph (buildings that are important for regional or national emergency response and preparedness).
In the dropdown menu "sea level," you can choose:
- Now
- 2100
- 2150
Choose "now" to visualize present-day extreme still water levels. By selecting "2100" or "2150," you can visualize extreme still water levels in combination with the future climate allowances recommended by DSB. The visualization takes into account sea-level changes up to 2100 or 2150, and accounts for vertical land motion. Note that not all water levels are available for all climate years, as only the variants described in the DSB guidelines are included. The table below provides an overview of the possible choices.
| Security class for storm surge | Now | 2100 | 2150 |
| F1: 20-year return level | Yes | - | - |
| F2: 200-year return level | Yes | Yes | - |
| F3: 1000-year return level | Yes | Yes | - |
| High-end estimate level | Yes | Yes | Yes |
As sea-level change will vary along the Norwegian coast, numbers will vary from place to place. The precautionary principle underlies the choice of climate allowance. As described in more detail in the DSB guidelines, the top of the likely range for the medium confidence sea-level projections for the emissions scenario SSP3-7.0 is used. Read more about the different scenarios and see the report "Sea-Level Rise and Extremes in Norway" for more details.
Recommended Values for Municipalities
The dataset "storm surge and sea level" available on Geonorge contains the recommended values for municipality planning as given in DSB’s guidelines. By clicking on the link "view in map" in the metadata section on Geonorge, it is possible to select different map layers. Click on the map to bring up metadata where "VannstandOverNN2000" is the recommended height (cm) to use in planning and from DSB’s guidelines. This information is also available via a WMS, which can be used in software such as QGIS.
There is no longer one value per municipality for a given combination of storm surge and sea level. Instead, all values are rounded up to the nearest 10 cm and geographically grouped based on this. Some municipalities will still have one value to relate to, while others may have two or more.
Sea level allowances can be updated or changed based on new knowledge or new guidelines. Recommendations are usually revisited or revised every few years, and any potential changes will be communicated to users well in advance. The extreme still water levels are, however, continuously updated based on improved data and methods.
Uncertainty in Extreme Still Water Levels to NN2000
Extreme still water levels, storm surge levels, are calculated based on statistical analyses of tide gauge series up to 2023. The quality is mainly determined by the length of the data series and how well this series represents the water level in the area. The quality of such water level series along the coast is described in more detail in the article "quality of tidal and water level data" and is generally better the closer the area is to one of the permanent tide gauges. The length of the time series depends on the permanent water level gauge.
Extreme still high-water levels are calculated relative to mean sea level. To map affected areas on land, these must be converted to NN2000. The models used for this are most accurate near the permanent water level gauges. Elsewhere, the uncertainty associated with converting high water levels may be greater than the uncertainty related to the height model.
Mapping Methods
In modelling flooded areas, the national height model from hoydedata.no was used. The terrain model is based on airborne laser measurements (LiDAR) and has a horizontal resolution of 1x1 meter and a vertical accuracy typically better than 0.1 meters.
However, the accuracy will vary depending on the terrain and when the data collection was carried out, and discrepancies between the map and the terrain may occur. Significant discrepancies may occur in flat areas, such as beaches and low-lying islands. Modelling of flooded areas will be updated when the terrain model is updated with changes in the terrain or improved mapping quality.
Areas with Lower Quality
In some smaller areas along the coast, we do not have the necessary data to provide extreme still water levels. This is typically in fjord arms and basins with a significant constriction, causing the tide to behave differently than on the outer coast. The constriction causes the basin to fill up more slowly, and the tidal range is slightly smaller inside than outside. These areas have received high water level values (and mean high water) based on the areas outside, so the elevation levels in these areas might be overestimated. The same applies to flooded areas. This applies to all polygons with quality 3–4 in the map showing the quality of modelled water levels.
For parts of Jæren, we still do not have sufficient data to model water levels. However, we have been able to calculate mean high water[MS1] . This means that the value for this stretch is not overestimated as it is for other areas without modelled water levels, but the quality will still be somewhat lower than in most other places along the coast. The same applies to Mofjorden and a small area in Lindås.
Users should consider all the information above when using data and maps provided by the service.
Questions about the service can be directed to the Norwegian Mapping Authority's customer service at kundesenter@kartverket.no.
Publications
More details on extreme water levels and sea level changes can be found in the following publications:
- Breili, K.; Simpson, M.J.R.;, Klokkervold, E; Ravndal, O.R.;. High-accuracy coastal flood mapping for Norway using lidar data. Nat. Hazards Earth Syst. Sci. 2020, 20, 673–694.
- Simpson, M.J.R., Bonaduce, A., Borck, H.S., Breili, K., Breivik, Ø., Ravndal, O.R., Richter, K., 2024. Sea-Level Rise and Extremes in Norway: Observations and Projections Based on IPCC AR6. Norwegian Centre for Climate Services report 1/2024, ISSN 2704-1018, Oslo, Norway.
Se havnivå i kart Visualize Sea Level
See consequences of sea level changes in an interactive map. The web tool visualize present-day storm surge levels and future sea level rise:
The mail has been sent!