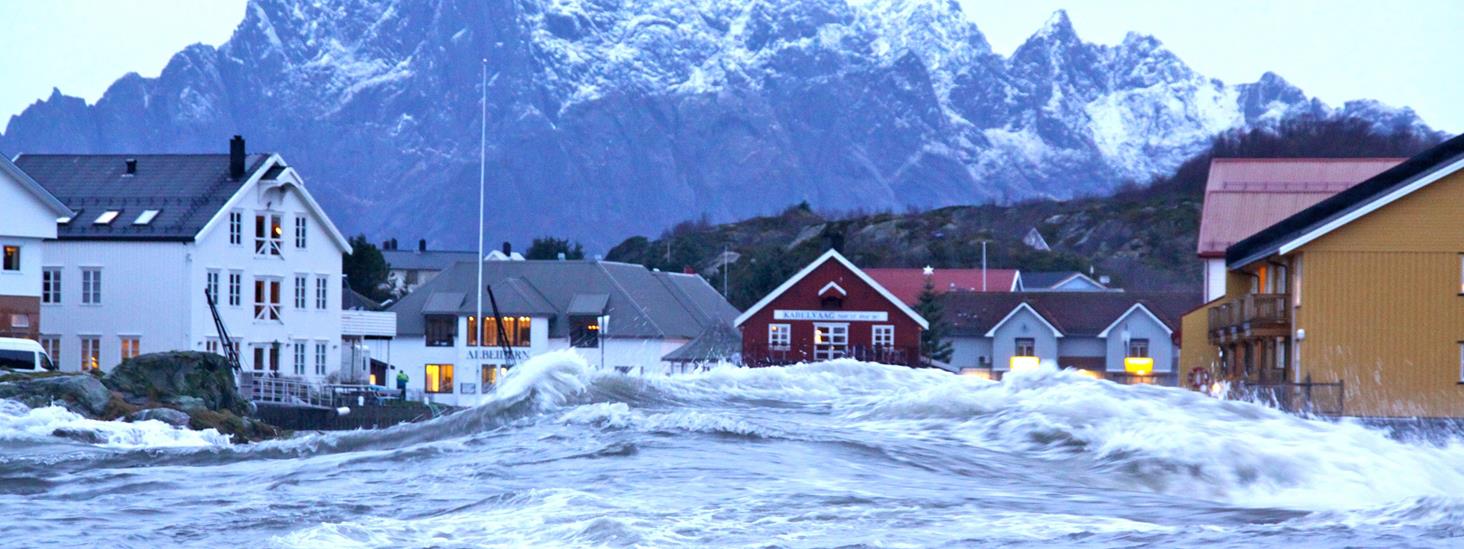
What does storm-surge mean?
A storm-surge occurs when meteorological effects cause an extreme rise in water levels. Especially wind and changes in air pressure affect the water level.
The word storm-surge is often used when referring to sea level extremes, although a storm-surge is not always enough for the water level to reach such heights.
What is water level?
On the permanent tide gauges, the Norwegian Mapping Authority observes the combination of astronomical tide and the meteorological surge. The astronomical tide is the result from gravitational effects from the sun and moon.
However, changes in air pressure and wind can significantly change the water level. This is what happens when a storm-surge occurs: Low air pressure leads to high water levels. As a general rule, if the air pressure drops by one hectopascal (hPa) or one millibar (mb), the water level rises by one centimetre. A powerful low pressure system of 960 hPa will cause the water to rise approximately 50 centimetres.
Wind also plays a crucial role in how high the water level is. The wind can push water towards the shore, creating an excess of water concentrated along the coast. When it comes to the Norwegian coast, this is mostly wind from the south and west.
Strong winds in the North Sea can also create long waves that travel along the coast, causing water levels to rise dramatically even though the wind is calm locally.
Local wind waves hitting the shore are not observed at the tide gauges and they are not taken into account when considering the water level or storm surge.
When will a storm-surges result in an extreme still water level?
Sea level extremes usually occur when a storm-surge coincides with so-called high astronomical tides. Tidal differences vary in a lunar cycle, and we experience the largest differences one to two days after the new and full moons in western and northern Norway. These are called spring tides. In addition to this the tidal differences vary through the year.
In Southern Norway and the Oslo fjord, the spring tides occur two to three days before the new and full moons. However, in these regions the tidal differences are so small that a sea level extreme can occur even without a high astronomical tide.
Major devastation after a storm-surge
Storm-surges have also caused major flooding along the Norwegian coast. One example is the storm Elsa from February 10th – 11th 2020, which gave extremely high observed water level for most of the Western coast. In Måløy, the highest observation since the start of the measurements in 1943 was observed, while for Bergen and Stavanger the water level reached only a few cm below the record.

At the tide gauge in Hammerfest, a record storm-surge was measured in January 2024. In addition, the tide was high, and the water level was only a few cm below the record from 2011. Only two weeks later, in February 2024, the spring tides were about 30 cm higher and a similar storm surge would have caused a much larger flooding.
Storm-surge warning
Fortunately, there exists a warning system for storm-surges and sea level extremes. The Norwegian Mapping Authority in close collaboration with the Norwegian Meteorological Institute issues a water level forecast for the next five days. This includes the astronomical tide and the Norwegian Meteorological Institute’s forecast of the meteorological surge. The Norwegian Meteorological Institute also issues weather warnings for sea level extremes, with colours yellow, orange or red depending on the severity. These warnings are also available through Varsom.
More frequent and higher storm-surges in the future
Projections of sea level changes along the Norwegian coast to year 2150 is calculated in a report from 2024: «Sea level rise and extremes in Norway». The report was commissioned by the Norwegian Environment Agency and compiled by the Norwegian Centre for Climate Services (the Norwegian Mapping Authority, the Norwegian Meteorological Institute, NORCE) and the Nansen center . It describes how the sea will rise along the Norwegian coast, and how it will affect water levels during a storm-surge.
Se havnivå Water Level and Tides
Se havnivå provides information about water level, tides, vertical datums, land uplift and future sea level projections for the Norwegian coast:
Se havnivå i kart Visualize Sea Level
See consequences of sea level changes in an interactive map. The web tool visualize present-day storm surge levels and future sea level rise:


The mail has been sent!